What Happened
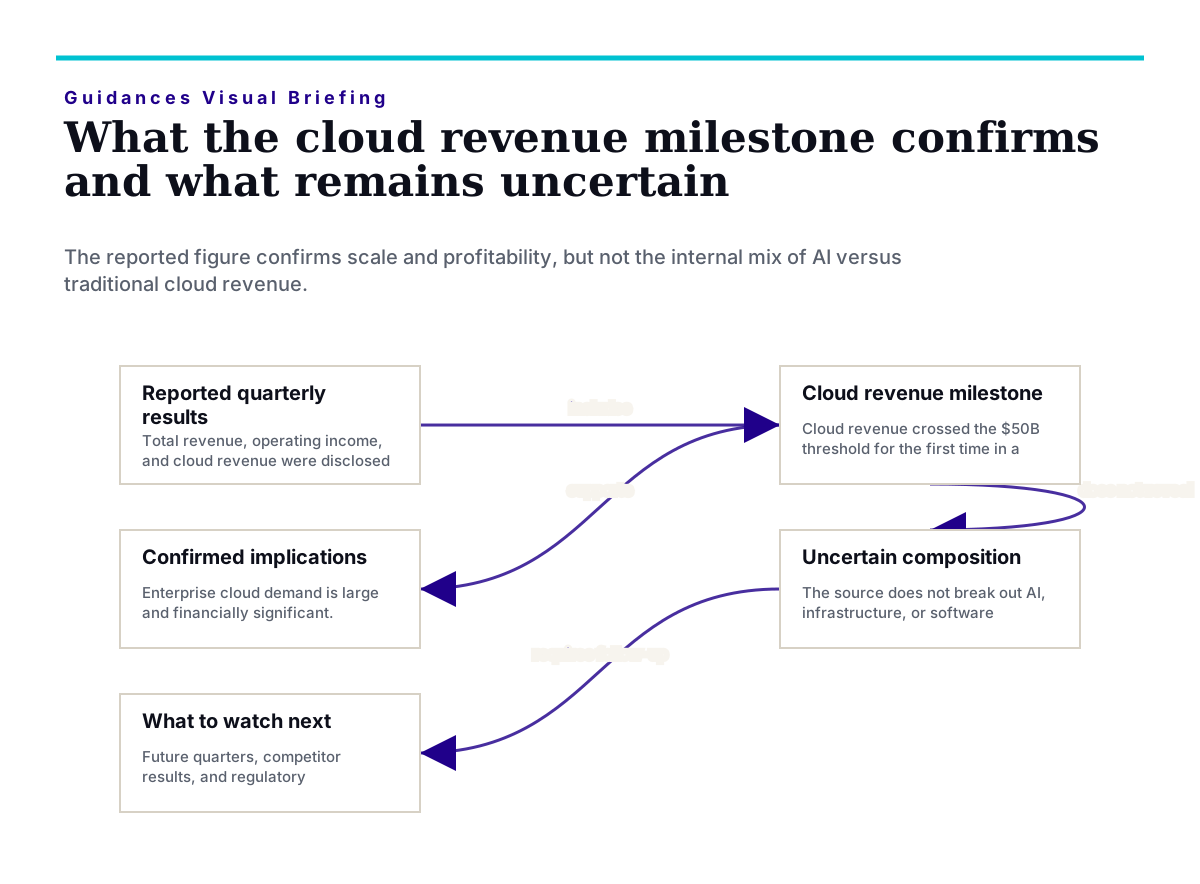
Microsoft published its fiscal second-quarter earnings results on its official newsroom on January 28, 2026, disclosing total revenue of $81.3 billion, operating income of $38.3 billion, and Microsoft Cloud revenue of $51.5 billion. Management noted that cloud revenue had crossed the $50 billion threshold for the first time in a single reporting period, linking the result to enterprise demand.
This analysis is based on the official Microsoft newsroom snippet. The snippet does not provide segment-level breakdowns beyond the aggregate cloud revenue figure, nor does it detail the composition of AI versus traditional workloads within that total. Analytical inferences drawn in this article are labeled as such and should not be read as source-confirmed facts.
This article is market context only and does not constitute investment advice.
Why the Market Cares
The $50 billion quarterly cloud threshold is a reference point for assessing the scale of enterprise IT spending on cloud services. For operators and founders building on cloud platforms, the figure represents an official data point showing that enterprise cloud expenditure has normalized at a substantial scale.
Total revenue of $81.3 billion alongside operating income of $38.3 billion implies an operating margin in the mid-to-high forty percent range for the quarter. This is a single-quarter observation; whether the margin level is sustained, expands, or compresses will require subsequent quarters of data to assess. The simultaneous reporting of revenue and operating income at these levels is, however, an observable fact about the current financial structure of the cloud business as reported.
Microsoft's enterprise customer relationships span a broad range of industries, including financial services, healthcare systems, manufacturing, government, and retail. The breadth of that customer base means the company's cloud demand figures may reflect a wider cross-section of enterprise IT spending than those of more narrowly focused vendors. This interpretation is analytical inference, not a claim confirmed directly by the source.
Tech / Policy Link
The cloud revenue milestone arrives at a moment when policy discussions related to AI infrastructure are active across multiple jurisdictions. Regulatory conversations in the United States and the European Union concerning AI procurement, data residency, and cloud service bundling practices are publicly documented. However, the extent to which these policy discussions directly shaped Microsoft's reported quarterly results, or will affect future quarters in specific ways, is not established by the source material for this article.
Microsoft's public positioning of its Azure platform alongside AI services is a matter of public record. The precise composition of the $51.5 billion cloud figure—how much derives from traditional infrastructure-as-a-service, software-as-a-service, or AI-related services—is not broken out in the newsroom snippet on which this article is based. Treating the aggregate figure as direct evidence of specific AI workload monetization would therefore exceed what the source supports.
On the policy environment, regulatory interest in large cloud vendors' bundling practices, interoperability, and data portability has been publicly expressed in both the U.S. and EU. Whether and how such regulatory attention translates into formal requirements affecting contract structures or revenue recognition practices remains to be determined. Operators building on these platforms have reason to monitor regulatory developments in both jurisdictions as a material operating condition, though specific outcomes and timelines are not currently determinable.
Market Lens
Trigger: Microsoft's official disclosure of $51.5 billion in quarterly cloud revenue, crossing the $50 billion threshold for the first time in a single reporting period.
Observable facts: Total revenue of $81.3 billion, operating income of $38.3 billion, and cloud revenue of $51.5 billion were reported in the same quarter. These three figures are confirmed by the Microsoft official newsroom.
Analytical context (inference labeled): Cloud infrastructure, enterprise software, AI semiconductor demand, data center-related infrastructure, and networking equipment are sectors with publicly documented connections to hyperscaler capital expenditure cycles. However, the specific effect of Microsoft's quarterly figures on individual vendors in those sectors requires company-level disclosures to assess. Sector connections noted in this article reflect general supply-chain analysis, not source-specific causal claims.
Time horizon: The quarterly cadence of cloud revenue reporting means the next comparable data point is approximately three months away. Having crossed the $50 billion threshold for the first time, any material change in growth rate in subsequent quarters will attract heightened attention relative to prior periods.
Next check: Microsoft's next quarterly earnings disclosure will be the primary verification point. In the interim, earnings reports from Amazon Web Services and Google Cloud will provide comparative demand context. Enterprise IT spending surveys, semiconductor order data, and data center construction indicators are secondary signals worth monitoring.
This section is market context only, not investment advice. Sector connections noted above reflect general supply-chain analysis based on publicly documented relationships, not source-specific causal claims.
What to Watch Next
Several forward-looking questions emerge from this milestone that operators and market participants should track.
1. Margin trends as AI workloads scale. Generative AI inference is computationally intensive. If AI-related workloads grow as a share of cloud revenue, the cost structure of delivering that revenue—including GPU depreciation, energy, and cooling—will be a factor in subsequent margin outcomes. Whether the operating margin level observed this quarter is sustained, expands, or compresses is not determinable from the current data point alone.
2. Comparative results from competing hyperscalers. Amazon Web Services and Google Cloud both operate their own cloud strategies and will report quarterly results that provide comparative data. Those results will help clarify whether Microsoft's cloud growth reflects broad market demand expansion, vendor-specific dynamics, or some combination of both.
3. Enterprise contract structure evolution. As AI capabilities become embedded in cloud agreements, the distinction between software licensing, platform fees, and AI model access charges is shifting. How enterprise procurement teams respond—through multi-cloud strategies, negotiated terms, or responses to regulatory developments—will influence the revenue composition of future quarters.
4. Regulatory developments in AI cloud bundling. Regulatory interest in how AI model access is packaged with cloud infrastructure has been publicly expressed in both the U.S. and EU. Any formal inquiry, guidance document, or legislative proposal in this area could affect contract terms and revenue recognition practices. Specific outcomes and timelines are not currently determinable.
Uncertainty and Constraints
This analysis is based on the official Microsoft newsroom snippet and publicly available financial metadata. The snippet does not provide segment-level breakdowns beyond the aggregate cloud revenue figure, nor does it detail the composition of AI versus traditional workloads within the $51.5 billion total. The operating margin figure cited is derived from the reported quarterly revenue and operating income numbers and is an estimate; it may differ from any official margin disclosure by the company.
Forward-looking statements about demand sustainability, competitive dynamics, regulatory outcomes, and sector-level effects are analytical inferences, not source-confirmed facts. This article does not constitute investment advice and does not recommend buying, selling, or holding any security.